skbio.stats.ordination.OrdinationResults.plot#
- OrdinationResults.plot(df=None, column=None, axes=(0, 1, 2), axis_labels=None, title='', cmap=None, s=20)[source]#
Create a 3-D scatterplot of ordination results colored by metadata.
Creates a 3-D scatterplot of the ordination results, where each point represents a sample. Optionally, these points can be colored by metadata (see df and column below).
- Parameters:
- dfpd.DataFrame, optional
DataFramecontaining sample metadata. Must be indexed by sample ID, and all sample IDs in the ordination results must exist in theDataFrame. IfNone, samples (i.e., points) will not be colored by metadata.- columnstr, optional
Column name in df to color samples (i.e., points in the plot) by. Cannot have missing data (i.e.,
np.nan). column can be numeric or categorical. If numeric, all values in the column will be cast tofloatand mapped to colors using cmap. A colorbar will be included to serve as a legend. If categorical (i.e., not all values in column could be cast tofloat), colors will be chosen for each category using evenly-spaced points along cmap. A legend will be included. IfNone, samples (i.e., points) will not be colored by metadata.- axesiterable of int, optional
Indices of sample coordinates to plot on the x-, y-, and z-axes. For example, if plotting PCoA results,
axes=(0, 1, 2)will plot PC 1 on the x-axis, PC 2 on the y-axis, and PC 3 on the z-axis. Must contain exactly three elements.- axis_labelsiterable of str, optional
Labels for the x-, y-, and z-axes. If
None, labels will be the values of axes cast as strings.- titlestr, optional
Plot title.
- cmapstr or matplotlib.colors.Colormap, optional
Name or instance of matplotlib colormap to use for mapping column values to colors. If
None, defaults to the colormap specified in the matplotlib rc file. Qualitative colormaps (e.g.,Set1) are recommended for categorical data, while sequential colormaps (e.g.,Greys) are recommended for numeric data. See [1] for these colormap classifications.- sscalar or iterable of scalars, optional
Size of points. See matplotlib’s
Axes3D.scatterdocumentation for more details.
- Returns:
- matplotlib.figure.Figure
Figure containing the scatterplot and legend/colorbar if metadata were provided.
- Raises:
- ValueError
Raised on invalid input, including the following situations:
there are not at least three dimensions to plot
there are not exactly three values in axes, they are not unique, or are out of range
there are not exactly three values in axis_labels
either df or column is provided without the other
column is not in the
DataFramesample IDs in the ordination results are not in df or have missing data in column
Notes
This method creates basic plots of ordination results, and is intended to provide a quick look at the results in the context of metadata (e.g., from within the Jupyter Lab). For more customization and to generate publication-quality figures, we recommend EMPeror [2].
References
[2]EMPeror: a tool for visualizing high-throughput microbial community data. Vazquez-Baeza Y, Pirrung M, Gonzalez A, Knight R. Gigascience. 2013 Nov 26;2(1):16. http://biocore.github.io/emperor/
Examples
Define a distance matrix with four samples labelled A-D:
>>> from skbio import DistanceMatrix
>>> dm = DistanceMatrix([[0., 0.21712454, 0.5007512, 0.91769271],
...                      [0.21712454, 0., 0.45995501, 0.80332382],
...                      [0.5007512, 0.45995501, 0., 0.65463348],
...                      [0.91769271, 0.80332382, 0.65463348, 0.]],
...                     ['A', 'B', 'C', 'D'])
Define metadata for each sample in a
pandas.DataFrame:>>> import pandas as pd >>> metadata = { ... 'A': {'body_site': 'skin'}, ... 'B': {'body_site': 'gut'}, ... 'C': {'body_site': 'gut'}, ... 'D': {'body_site': 'skin'}} >>> df = pd.DataFrame.from_dict(metadata, orient='index')
Run principal coordinate analysis (PCoA) on the distance matrix:
>>> from skbio.stats.ordination import pcoa
>>> pcoa_results = pcoa(dm)
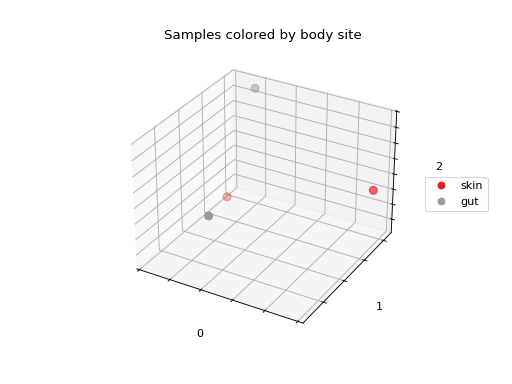
Plot the ordination results, where each sample is colored by body site (a categorical variable):
>>> fig = pcoa_results.plot(
...     df=df, column='body_site',
...     title='Samples colored by body site',
...     cmap='Set1', s=50
... )
