skbio.stats.distance.DistanceMatrix.plot#
- DistanceMatrix.plot(cmap=None, title='')[source]#
Create a heatmap of the dissimilarity matrix.
- Parameters:
- cmap: str or matplotlib.colors.Colormap, optional
Sets the color scheme of the heatmap If
None, defaults to the colormap specified in the matplotlib rc file.- title: str, optional
Sets the title label of the heatmap (Default is blank)
- Returns:
- matplotlib.figure.Figure
Figure containing the heatmap and colorbar of the plotted dissimilarity matrix.
Examples
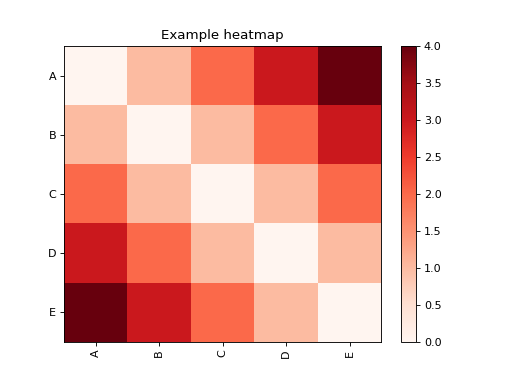
Define a dissimilarity matrix with five objects labeled A-E:
>>> from skbio.stats.distance import DissimilarityMatrix
>>> dm = DissimilarityMatrix([[0, 1, 2, 3, 4], [1, 0, 1, 2, 3],
...                           [2, 1, 0, 1, 2], [3, 2, 1, 0, 1],
...                           [4, 3, 2, 1, 0]],
...                          ['A', 'B', 'C', 'D', 'E'])
Plot the dissimilarity matrix as a heatmap:
>>> fig = dm.plot(cmap='Reds', title='Example heatmap')